

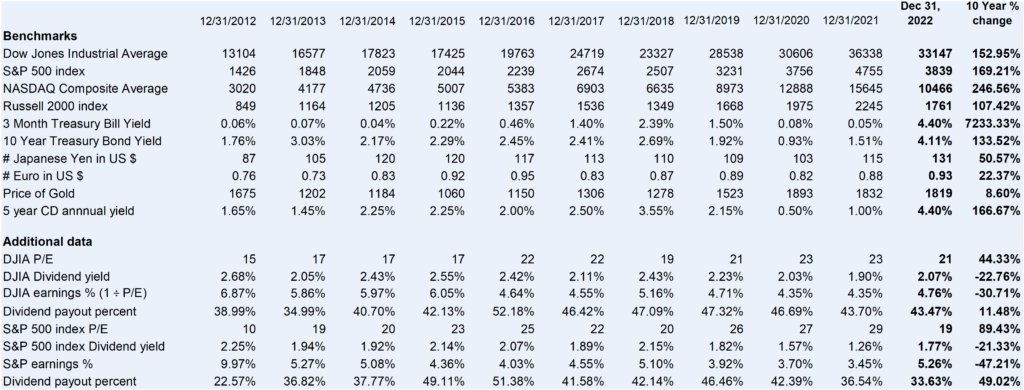
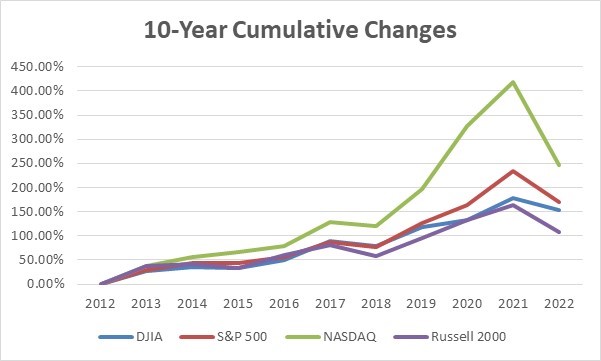
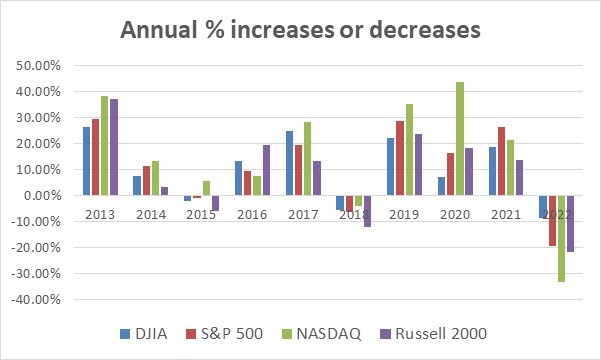
These charts continue an annual tradition I use to assist clients with their financial planning. The charts show the 10-year annual and cumulative percentage gains or losses of the major stock market indexes, interest rates, currencies, and gold.
The charts include the dividends paid, the price-to-earnings ratio and the index’s earnings and dividend payout percentages. Some of the amounts or calculations have been rounded to facilitate review. These charts are provided for illustrative and educational purposes. No recommendations are made or should be inferred from the information presented. Also, note that past results are no indicator of future performance. My next blog will have additional charts. The two blogs with charts will be followed by a blog where I discuss the results. These charts will end up in an updated stock market booklet I will then make available.
10-Year Financial Benchmark Performance of Major Stock Market Indexes, Interest Rates, Currencies and Gold
Contact Us
If you have any tax, business, financial or leadership or management issues you want to discuss please do not hesitate to contact me at [email protected] or click here.

