

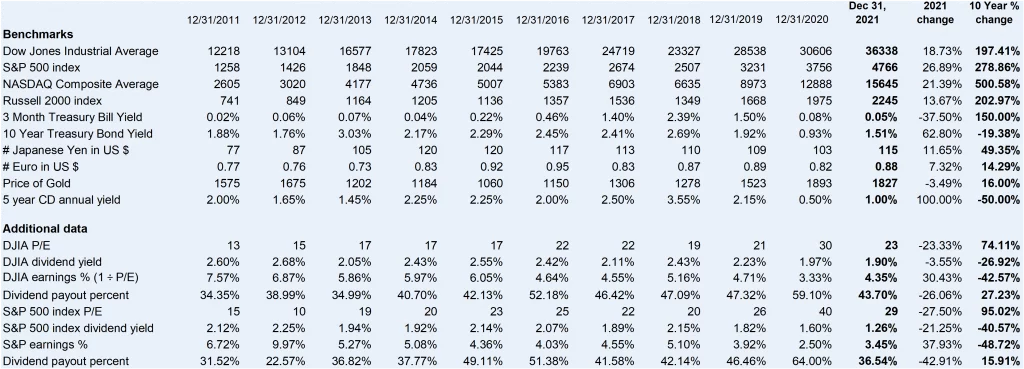
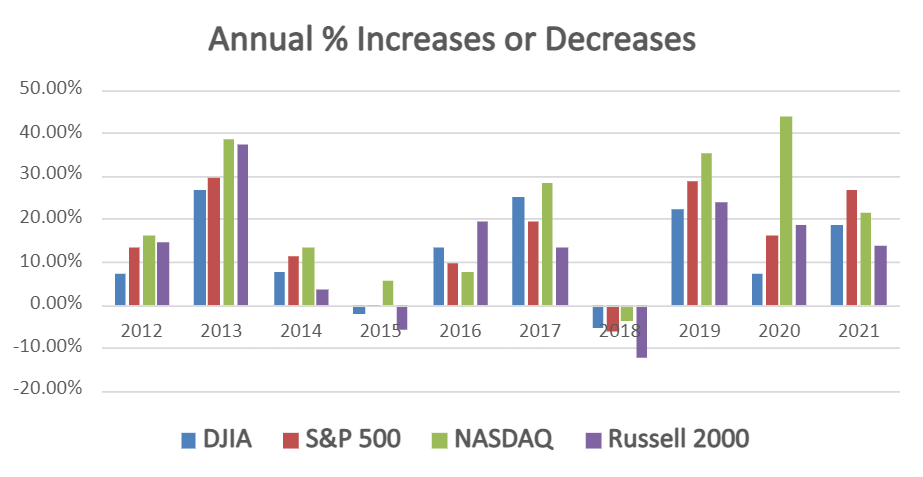
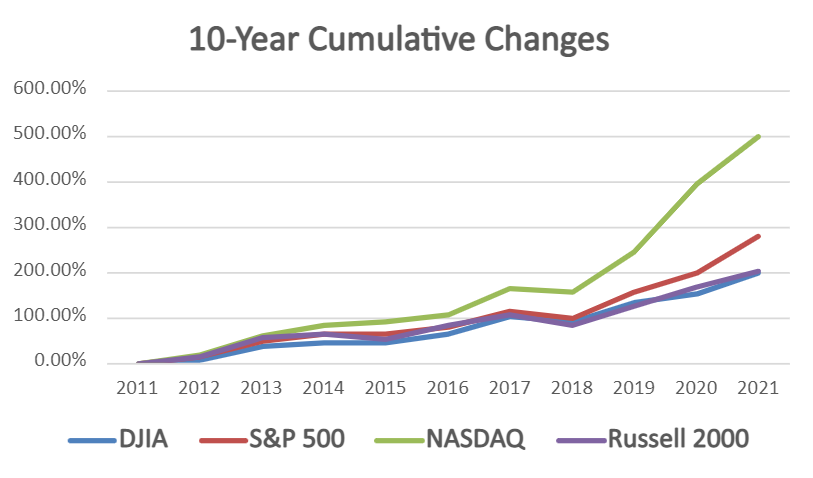
These year-end financial benchmark charts continue an annual tradition I use to assist clients with their financial planning. The charts show the 10-year annual and cumulative percentage gains or losses of the major stock market indexes, interest rates, currencies and gold. I always make new year’s resolutions, but Ialsoput “SALY” (Same as Last Year) after some of last year’s. Resolutions are made with great resolve, but things interfere. Sometimes it is the lack of a plan or time or a deadline; or sometimes it’s the inability to fit the resolution into the big picture of my life.
The charts include the dividends paid, price-to-earnings ratio, index earnings percent and dividend payout percent. Some of the amounts or calculations have been rounded to facilitate review. These charts are provided for illustrative and educational purposes. No recommendations are made or should be inferred from the information presented. Also, note that past results are no indicator of future performance. My next two blogs will have additional stock market charts followed by a blog where I discuss the results.10-year financial benchmark performance of major stock market indexes, interest rates, currencies and gold.
10-year financial benchmark performance of major stock market indexes, interest rates, currencies and gold
Contact Us
If you have any tax, business, financial or leadership or management issues you want to discuss please do not hesitate to contact me at [email protected] or click here.

